How will the senate vote?
D3, Data Visualization, Data Journalism
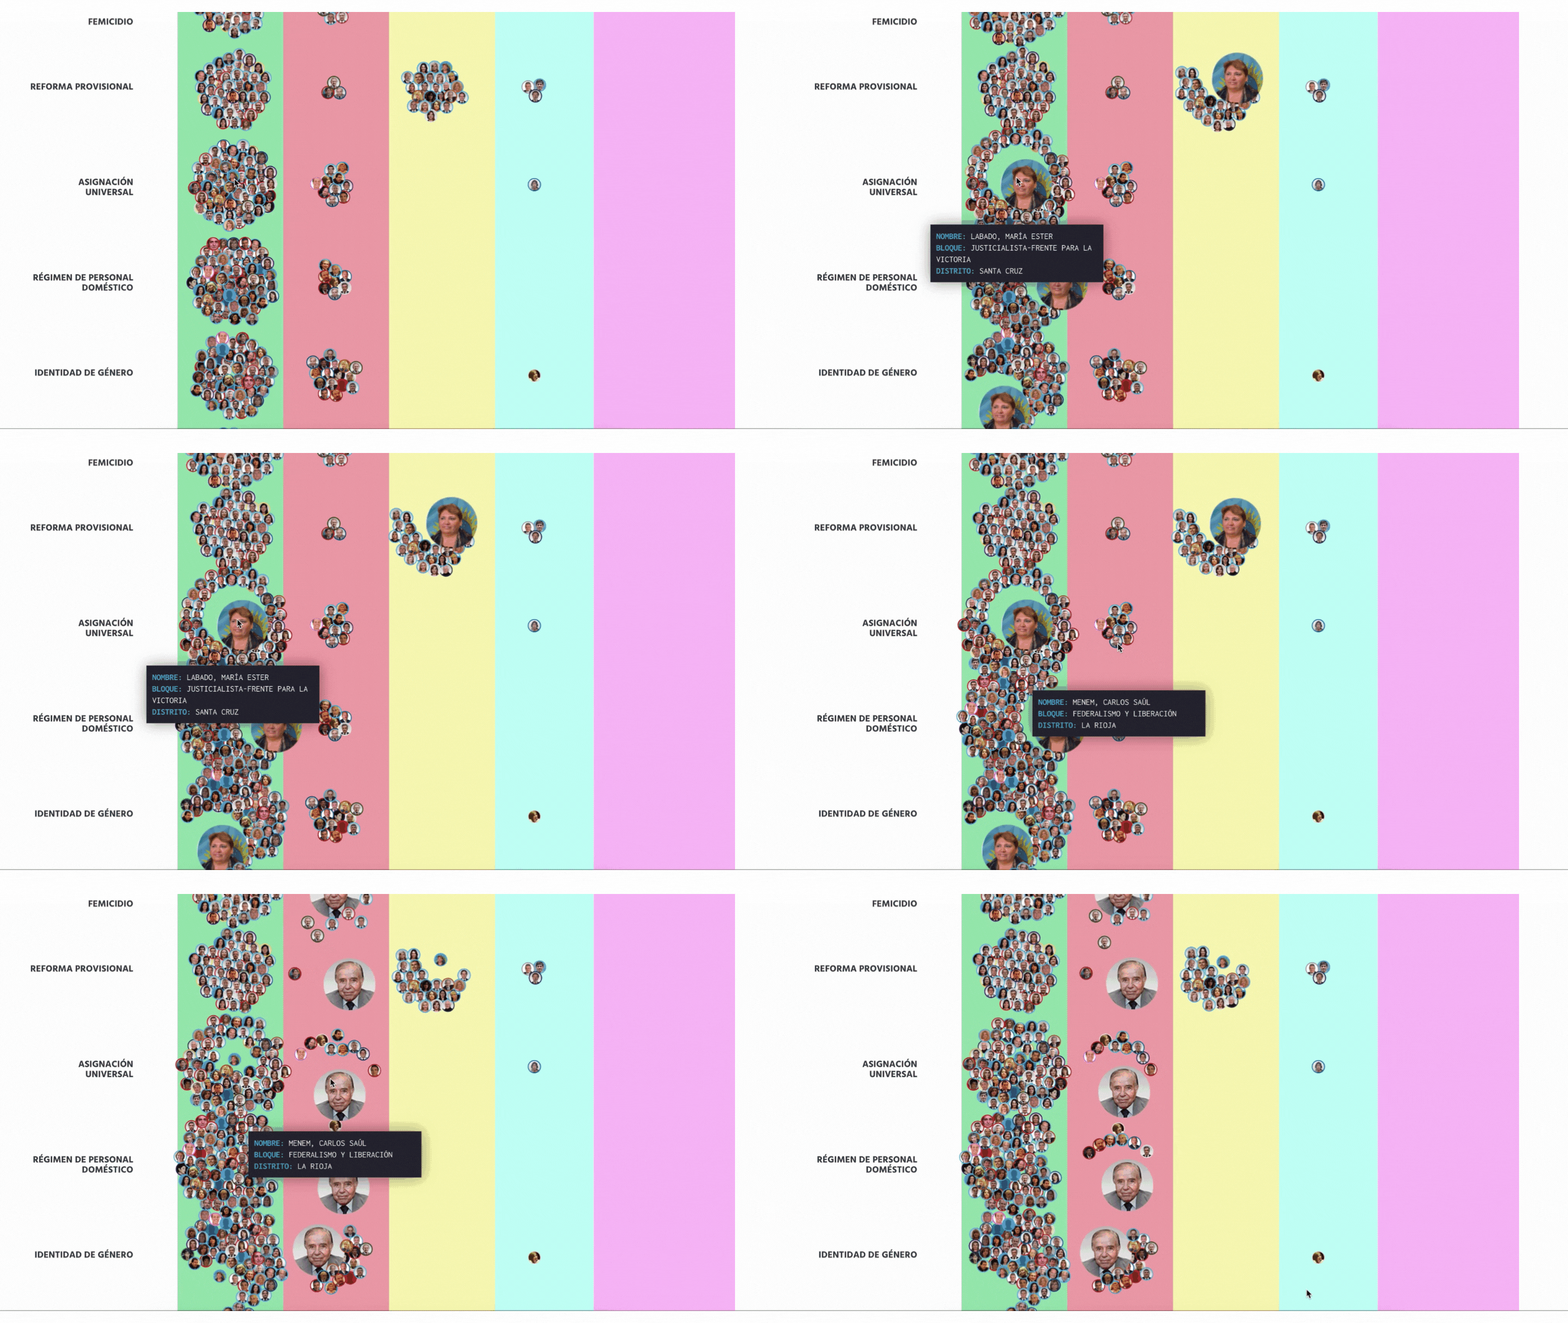
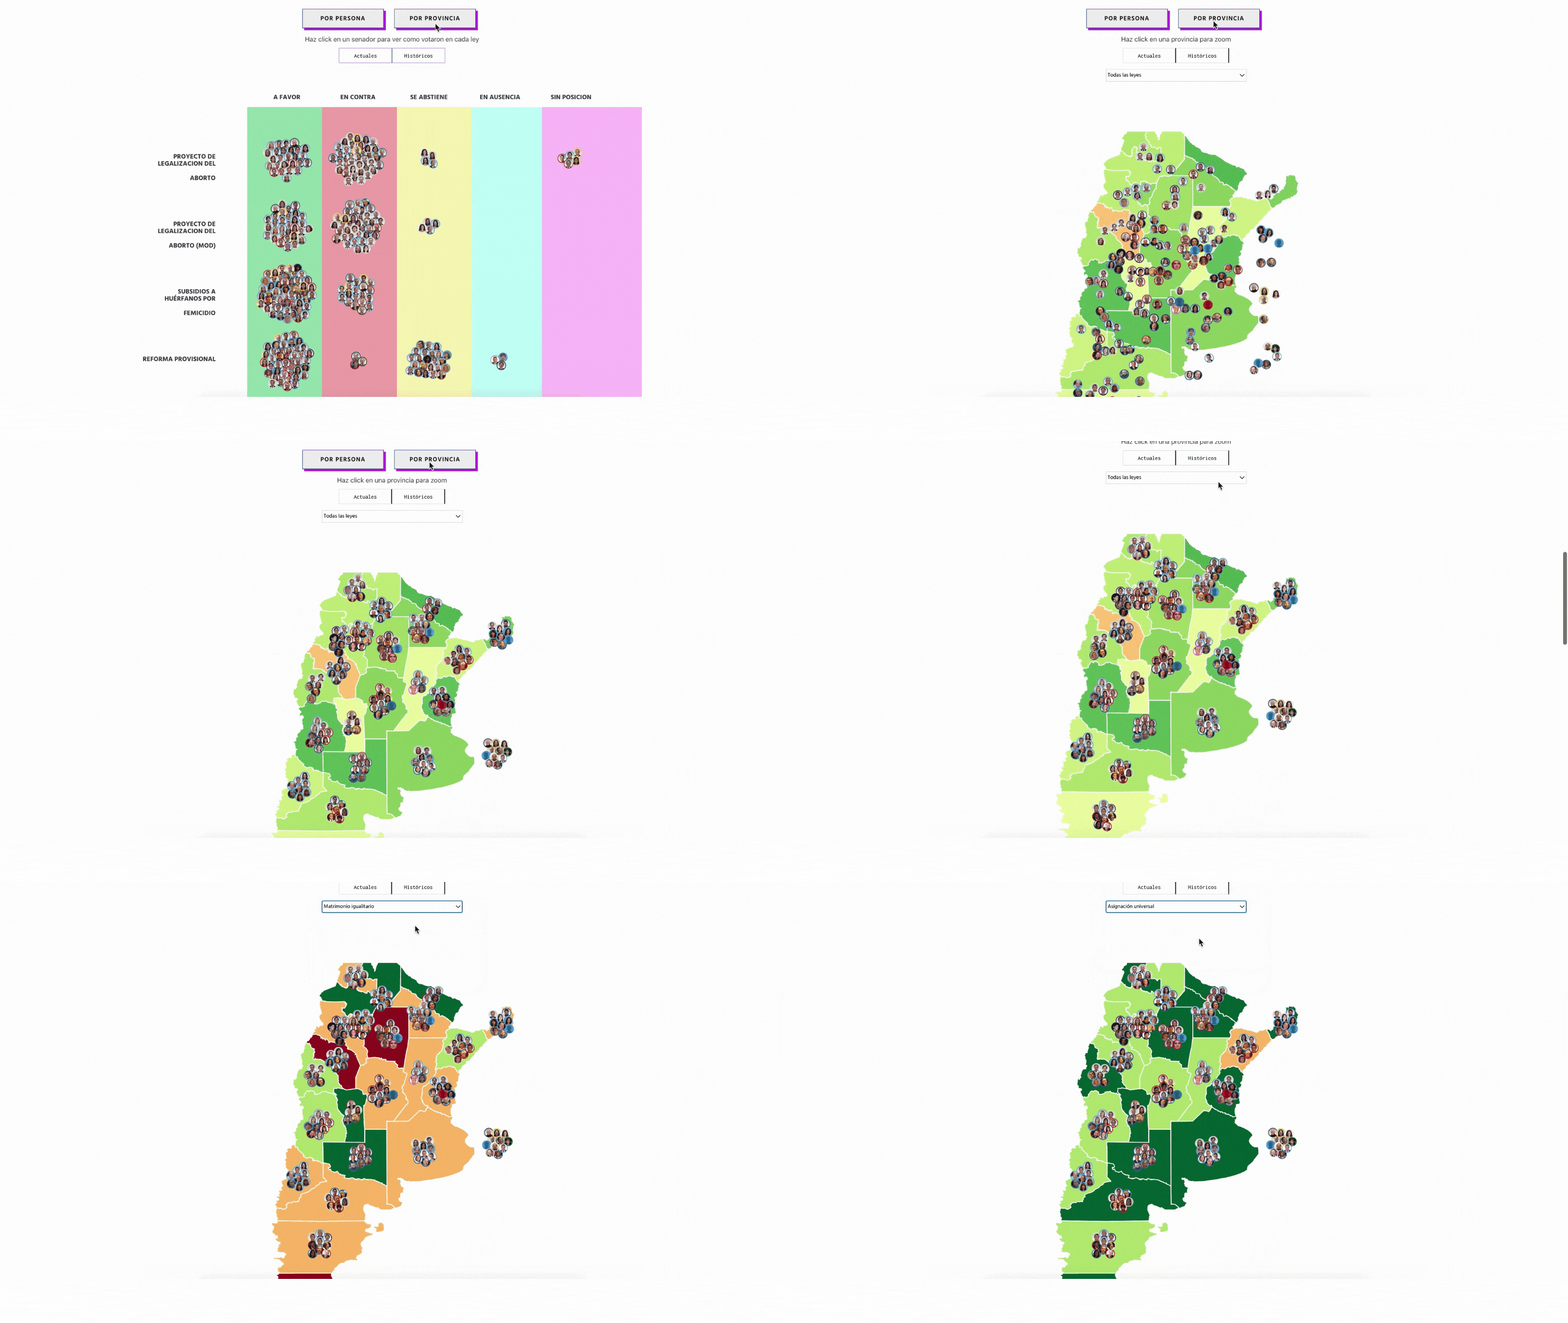
Before an important vote on the legalization of abortion in Argentina, I worked along with a programmer at the NGO ‘Conocimiento Abierto’ to create a visualization which let people easily see the way all the senators had previously voted on various social issues. We used D3 to make the visualization.
*The visualization was published in our in house data journalism publication called SIN NOMBRE.
We also wanted to make sure that you could take a closer look at each senator and so made the photo of each senator expand on hover and when you click it would also expand each instance of that senator so you could easily see how they voted across each issue.
We worked to a smooth transition between clustering the senators by issues they voted on and then by the state they each pertained to. On the map view we allowed the user to use a drop down to cycle through the various issues and see an average as to how each state voted, as soon by a gradient between green and red (yes and no).
Abortion Vote Visualization
Conocimiento Abierto
Buenos Aires, Argentina


